OPEC: A Prisoner's Dilemma Revisited
Read in 3 minutes
Given the back and forth in the media over the last few weeks about whether OPEC and Russia will or won’t extend their production curtailment agreement, it is worth taking pause to assess exactly what the producer group has achieved over the last year or so since their historic agreement was first implemented.
Back in late October last year, in advance of the 30 November 2016 OPEC meeting, we released a Client Note (later published as a blog on our website) titled “OPEC Decision Making: A Game Theory Approach”. The basic hypothesis presented was that beyond Saudi Arabia, as well as possibly the UAE and Kuwait, OPEC’s members were unlikely to proactively curtail production, although some would continue to see natural declines. The best Saudi Arabia could expect from Russia was a potential freeze in production growth.
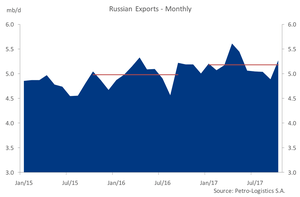
If we focus on crude oil exports as the most transparent and easily verifiable data, the simple story is that OPEC as a whole and Russia both exported more crude oil following the curtailment agreement than in the previous 12 months. From Petro-Logistics’ data, between October 2015 to September 2016, OPEC exported 23.91 mb/d on average, with this figure rising to 24.24 mb/d in 2017 through October. In the corresponding periods, Russia’s exports grew from 4.98 mb/d to 5.18 mb/d.
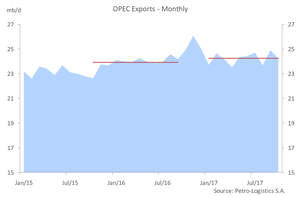
While combined exports from Saudi Arabia and UAE have reduced from 9.75 mb/d to 9.38 mb/d, this reduction has been more than offset by greater aggregate exports from other OPEC members, although the specifics vary by OPEC member.
Despite the increase in export volumes from OPEC and Russia, there has been a shift in the market both in terms of the time spreads for Brent, which moved from contango into backwardation over the last few months, and a reported reduction in OECD stocks. Key drivers of this shift in market structure and stock levels have been larger-than-expected demand growth and the impact of a very active hurricane season in the Gulf of Mexico that both curtailed offshore production in the area and forced temporary closures of US refineries. With less US refining capacity available, US crude exports rose dramatically, increasing the length of the supply chain on water, absorbing crude stock and creating a form of apparent demand. It is not yet clear when the market may feel the impact of this longer supply chain unwinding, although most US refineries are now back up and running.
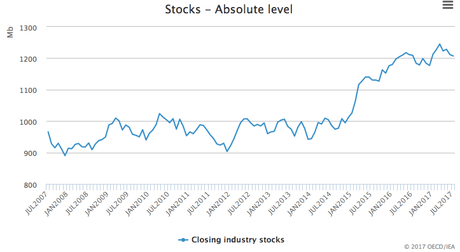
Turning our attention to stock levels, the most recent OECD stock data from the IEA highlights that through September 2017, OECD stocks remained higher than at the time of OPEC’s pre-curtailment agreement and substantially above historic levels. More recent declines in US stocks, as indicated from weekly data releases, have been driven by hurricanes, increased US exports and, more recently, the Keystone pipeline outage stranding crude in Canada. Assessments of the gap between the current and five-year average stock level conveniently ignore the reality that in more than half of the past five years stocks have been at elevated levels, which alone mathematically halves the gap.
As OPEC heads into its November 30th 2017 meeting with an apparent consensus to extend production cuts beyond March of 2018, we believe the prisoner’s dilemma is playing out largely as we had predicted with Saudi Arabia bearing the brunt of the load, supported in part by the UAE and Kuwait. With Saudi Arabia appearing happy, for now, to continue with the status quo, it is likely that the announcement on Thursday will be for an extension to the OPEC agreement. The question then is for how long Saudi Arabia will remain happy if something else does not give (e.g. Venezuela) or if US shale production continues its resurgence.