Every Tanker, Every Trend in One Place: The Petro-Logistics Crude Tanker Data Hub
Read in 2 minutes
If you are interested in a free trial of the crude Tanker Data Hub, please contact our sales team here.
Petro-Logistics has partnered with data visualization platform Oilytics (oilytics.co) to offer the ultimate tool for tracking all of our crude export data in one place. The Tanker Data Hub is the most comprehensive tool for macro- or micro-level viewing and manipulation of all our tanker-by-tanker data for crude oil, condensate, and upgraded crude oil.

Petro-Logistics’ data covers over 80% of global waterborne crude flows including from OPEC+, the FSU, the US Gulf Coast, and other crucial suppliers, with expanded coverage in development. The Tanker Data Hub allows you to see global, regional or local trends, or zoom in to individual tankers, ports, and companies and take fuller advantage of our unique grade-level information than ever possible before.

This online dashboard provides functionality for viewing data in the following ways.
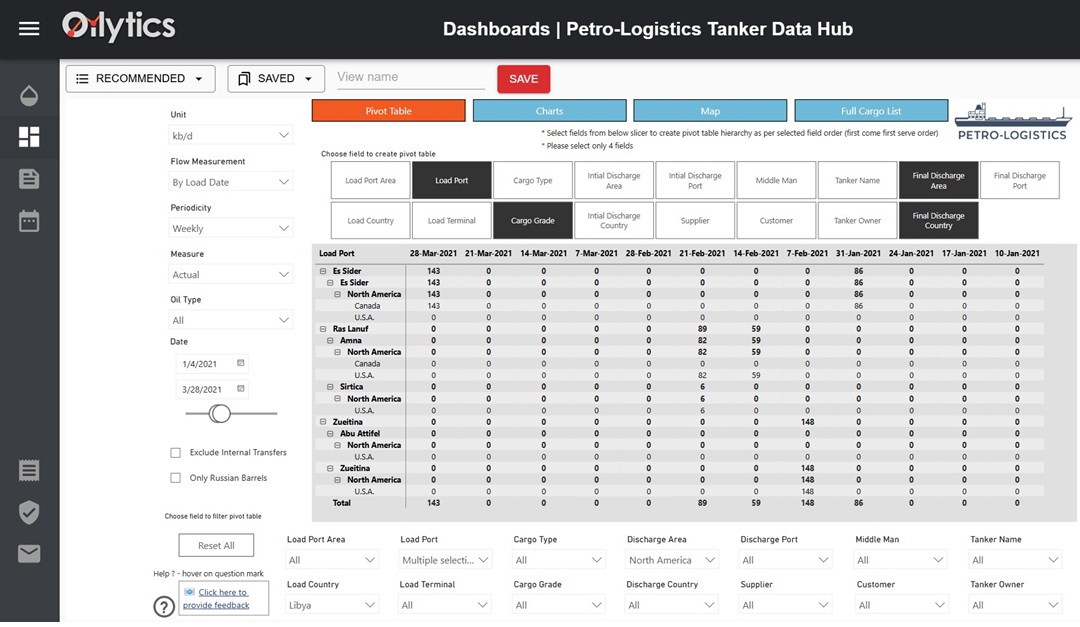
- Time series pivot tables with up to 4 nested category levels. One could, for example, create a weekly time series table of exports by load country, with nested sub-categories for crude grades, discharge country, and discharge port. Or thousands of other potential viewing combinations.
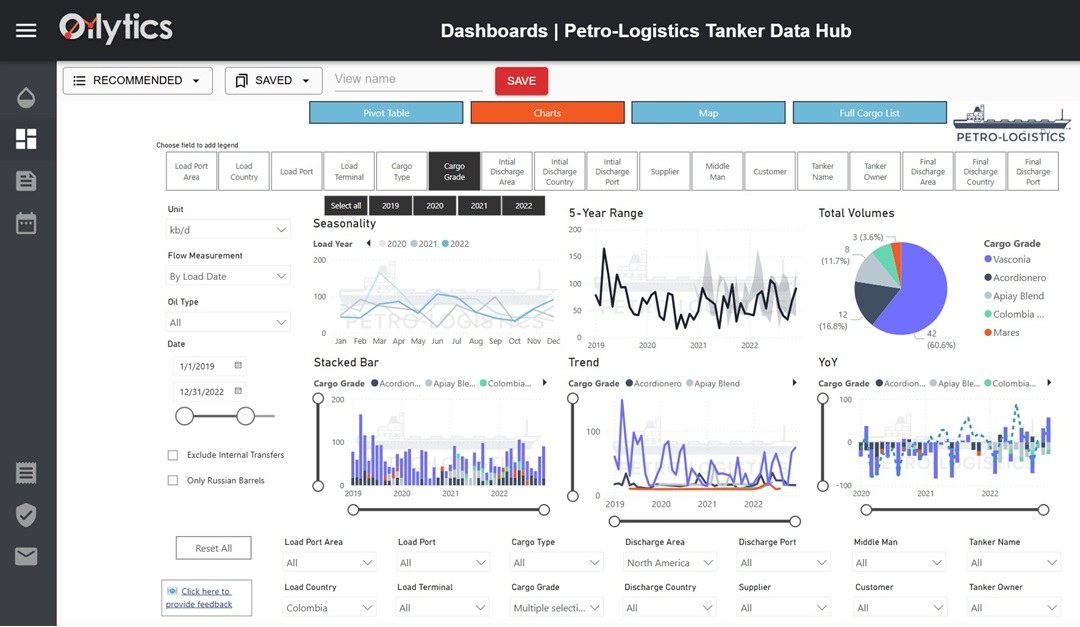
- 6 different customizable charts. 5 time series charts and one aggregate pie chart to view the data on a macro level in flexible ways. Adjust the filters and legends to view the data the way you need.
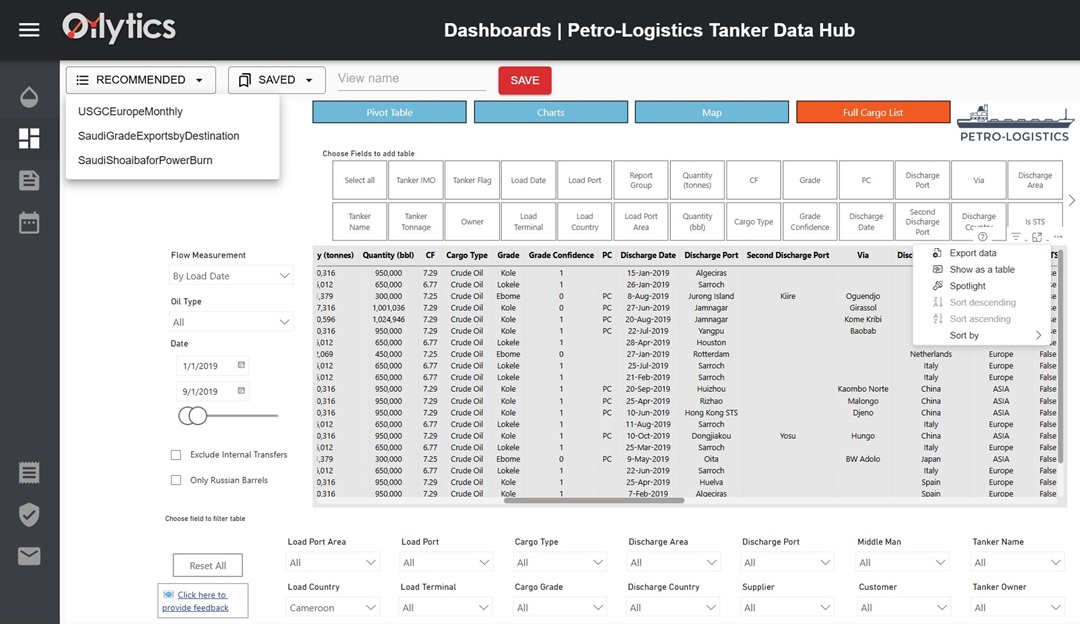
- Cargo-level detail. See full details of every cargo. Tanker names and IMOs, load and discharge locations, volumes, grades, suppliers, customers, Ship-to-Ship details, and all the other fields available in our API but with an improved tool to view and manipulate the data for quick analysis.
- Bookmarking functionality. Save the filters and viewing formats of most usefulness to you for immediate access whenever needed.
- Excel downloads. Quickly download time series from pivot tables or charts, or cargo details individually or in bulk with all available fields or just those you select.

Available filters and viewing options for tables, charts, and tanker data include load and discharge geographies down to the port level, cargo type, cargo grades, time frames (weekly, monthly, quarterly, annual), units (tons and barrels), suppliers, middlemen, customers, tanker names, and others.
Subscribers to our tanker level data have access to the Tanker Data Hub as an add-on service. Whether you currently subscribe to that data or are considering it, you can click here or email us at sales@petro-logistics.com for information on trials and pricing.


