OPEC Compliance: Watch the Area Under the Curve
Read in 4 minutes
It is worth taking a moment to look back at the market in mid-September 2016. This is before the September 28th OPEC meeting on the side lines of the IEF in Algiers. It is before the November 30th agreement by OPEC member countries to cut supply by around 1.2 mb/d for the first six months of 2017. And it is before Russia, Oman and other non-OPEC countries agreed on December 10th to cut a further half million barrels per day of production. In mid-September, expectations were that OPEC would not cut production and the supply surplus that had hung over the market since 2014 would persist, that OECD inventories would keep climbing and that prices would remain under pressure and test yet lower levels.
In that context, it is worth comparing what the market thought would happen at that time, and what has happened since.
In their September Monthly Oil Market Report, OPEC noted that global economic growth forecasts for 2016 had been revised lower. 2016-2017 non-OPEC supply was revised higher basis US shale and Norwegian production proving more resilient than expected in the face of lower prices. This resulted in a reduction in the call on OPEC crude to 31.7 mb/d in 2016 and 32.5 mb/d in 2017, while prevailing OPEC production in August was 33.2 mb/d (including Indonesia).
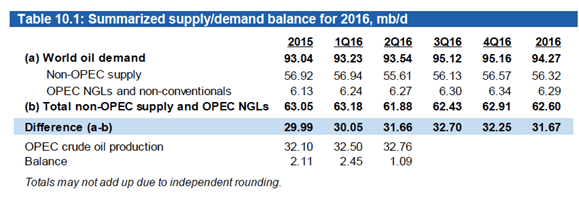
Source: OPEC’s September 2016 Monthly Oil Market Report
The IEA, in their September Oil Market Report, made similar observations, noting that global oil demand was slowing at a faster pace than initially predicted while OPEC supply stood 930 kb/d above year ago levels and OECD total inventories built to a fresh record of 3.1 Billion barrels. A net surplus supply was expected to continue, adding to inventories through 2017.
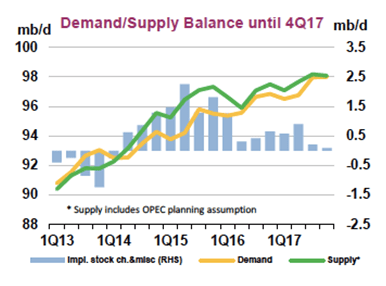
Source: IEA’s September2016 Oil Market Report
Having flirted with $50/bbl in the days prior to the release of these reports, Brent oil prices fell to $45 within the week. The outlook was overwhelmingly bearish, increasing the pressure on OPEC to act as we headed into the Algiers meeting at the end of September.
If we now flash forward to the end of 2016 and look at what happened in the ensuing months, it paints an interesting picture. Putting aside for a moment the various meetings and agreements to curtail production, physical crude supplied to market surged higher. In Q4 2016, excluding Indonesia, OPEC crude production as assessed by OPEC Secretariat was estimated at 33.13 mb/d, up half a million barrels per day over Q3 levels and a full 1.5 mb/d above the implied call on OPEC.
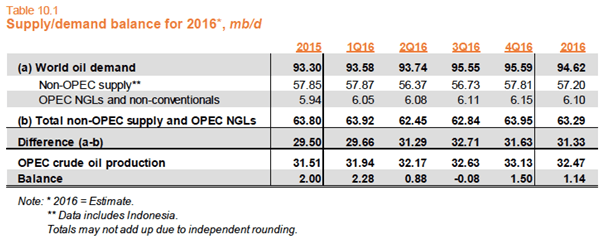
Source: OPEC’s February 2017 Monthly Oil Market Report
This surge in OPEC supply also manifested in an increase in OPEC exports, as can be seen in the below chart of OPEC-13 (excludes Indonesia) exports from January 2015 through month to date as on 15 February 2017. This chart is built from verified hard data on exports, captured by Petro-Logistics in our OPEC Production Monitor (with Data Package). OPEC exports in Q4 increased by over 130 million barrels (1.44 mb/d) vs. the trailing average 12-months, which is more than full OPEC compliance was intended to cut in Q1 2017.
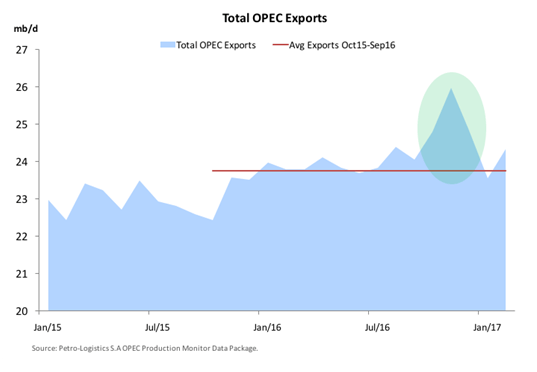
Zooming in to January 2017 we see that after the surge in Q4, exports returned to a level broadly in line with the average export volume in the trailing 12-months to September 2016. The first 15 days of February have seen exports increase above the trailing average.
With US shale having shown more resilience, even when prices were at $45/bbl, there are now signs that more non-OPEC supply may be forthcoming in 2017. In the early days of shale, it was extremely difficult to predict the supply potential and pace of growth of this new source. The pace of technology development continues to deliver efficiencies, a tendency that shows real signs of having been acutely honed through the price downturn.
If the OPEC cut is simply an above trend supply surge, followed by a return to near or even above trend levels of production, US Shale once again surprises to the upside and the economy cannot regain traction, there is a very real risk that some of the steam will come out of this market, unless other supporting factors come to bear.