The Indian Oil Bridge Between Russia and its Sanctioners
Read in 6 minutes
Since the invasion of Ukraine in February, Indian refiners have taken advantage of steep discounts to make the country one of the largest importers of Russian oil. There has been speculation about the possibility that Russian oil processed at Indian export refineries could be flowing as products to countries which have sanctioned Russia.
It is very difficult in practical terms to identify if precise oil molecules from Russia are landing in sanctioning countries. However, because of the fungible nature of oil, the data can at least show where Indian refiners who have Russian crude in their feedstock mix are sending their products. A rough ratio of what portion of those products may be attributable to Russian crude can then be inferred.
How much Russian crude is India importing?
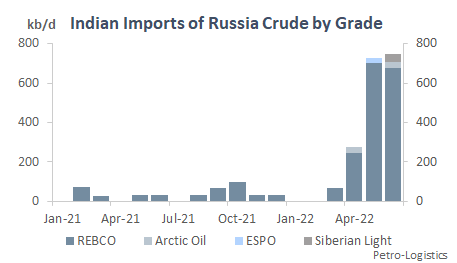
In the April to June 2022 period since shortly after the outbreak of the war in Ukraine (we exclude March as refiners had not yet had time to significantly react), Indian refiners imported an average of 583 kb/d of Russian crude. This compares to just 36 kb/d in 2021. Virtually all imports have been standard REBCO Urals, with some ESPO, Siberian Light, and Arctic Oil starting to come in at the margin.
April was the clear beginning of the uptick, with the 276 kb/d recorded that month already the highest in Petro-Logistics’ records going back to 2012. The peak during the measured period was in June at 747 kb/d, with May only slightly behind at 727 kb/d.
What crudes has Russian oil displaced in India?
While Russian barrels into India have displaced crudes from many different countries, the biggest losers have been the US, Latin America, and several (but not all) key Middle Eastern Gulf countries.
The grossly simplified overall picture is that Indian refiners have traded off a mixed basket of light and heavy crudes from the Americas for a single source of medium crude from Russia. The grades from the Middle East have simply been shuffled around between suppliers.
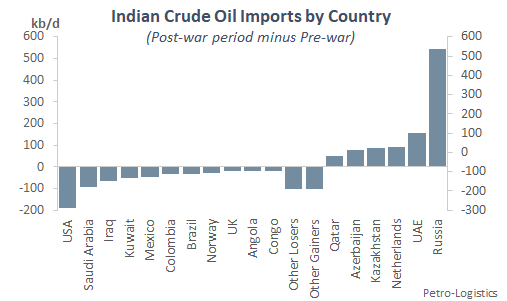
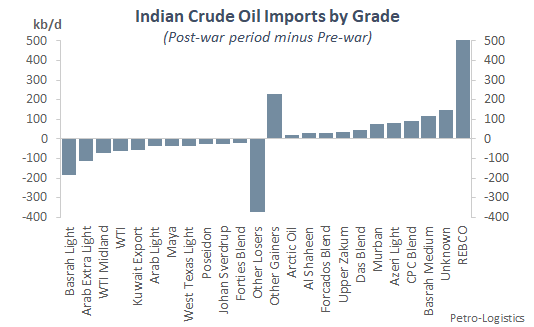
The US story is straightforward with the various West Texas grades falling -166 kb/d since the outbreak of the war. Small amounts of Bakken and Eagle Ford were also backed out. Everything lost from the US was light grades.
Latin American displacement was more widely dispersed, with Mexico, Colombia, and Brazil dropping by a combined -110 kb/d. These were all heavy to extra-heavy grades, led by Mexican Maya at -38 kb/d, Brazilian Lapa at -16 kb/d, Brazilian Roncador Heavy at -13 kb/d, and Colombian grades Apiay and Castilla at -12 kb/d and -11 kb/d respectively.
The Middle Eastern story is a little more complicated. The region at first glance only declined by -21 kb/d, but it hides some seller swapping. Saudi Arabia, Iraq, Kuwait, and Oman fell by a combined -224 kb/d, while the UAE and Qatar rose by 203 kb/d.
Within those switches, the UAE appears to have quite directly displaced light and moderately sour Arab Extra Light (-115 kb/d reduction) with its fairly similar Das Blend and Murban (121 kb/d increase). The rest of the volumes being swapped around were mostly medium sours replacing medium sours. Arab Light and Kuwait Export Blend flows to India, for example, fell a combined -96 kb/d while a basket of roughly similar Qatar Marine, Al Shaheen, and Upper Zakum rose by 80 kb/d.
Note that the switch from Basrah Light to Basrah Medium is a function of changing Iraqi grade availability and not so much war dynamics.
What products are being exported?
Indian product exports are heavily weighted towards middle distillates, and this has slightly increased since the outbreak of the war. April to June 2022 gasoil and kerosene exports were 1,353 kb/d or 52% of all products, versus 1,272 kb/d or 49% of all products in 2021.
Light ends in the form of gasoline plus naphtha were 1,158 kb/d or 44% of all products from April to June, versus 1,137 kb/d or 44% of all products in 2021. Fuel oil is lower at 70 kb/d for the April to June period versus 107 kb/d in 2021. Total product exports since the war have been 2,613 kb/d, very close to the 2021 average of 2,579 kb/d.
Given how close the numbers are and the inherent extra volatility in changes of export versus production numbers, it is hard to draw any strong conclusions on war impacts. However, the modest increase in middle distillate exports and decrease in fuel oil exports does match with what would be expected from the change in crude import slates. Replacing a “dumbbell” basket of heavy Latin American and light US grades with a more “pure” distillate feedstock of Urals ought to result in less fuel oil output and more middle distillates as the numbers suggest.
What portion of the exported products can be attributed to Russian crude?
While it is exceedingly difficult to track actual Russian oil molecules transformed from Urals to exported oil products, if we make some very simplified assumptions, we can estimate what portion of their products can be attributed to Russian crude.
We have taken the ratio of Russian crude imports versus the runs of the specific refiners who imported the crude and applied those percentages to their product exports since the war. This yields an estimate of 308 kb/d of Indian product exports possibly attributable Russian crude oil inputs.
50% or 154 kb/d of those exports are gasoil. Counting kerosene, 175 kb/d or 57% is middle distillates. For light ends, mogas and naphtha are 125 kb/d or 40%. The remaining 9 kb/d is majority fuel oil.
Where are those products being sent and what portion is theoretically attributable to nations with sanctions on Russia?
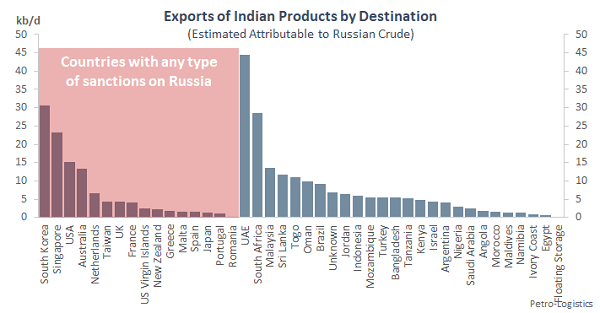
If we assume the estimated Russian-attributable products are part of blended pools at the refinery that go pro rata to the various destinations of Indian product exports, we can see there is a wide spread of regional destinations, with the largest being to Asia at 112 kb/d or 36%, followed by the Middle East at 68 kb/d and Africa at 64 kb/d.
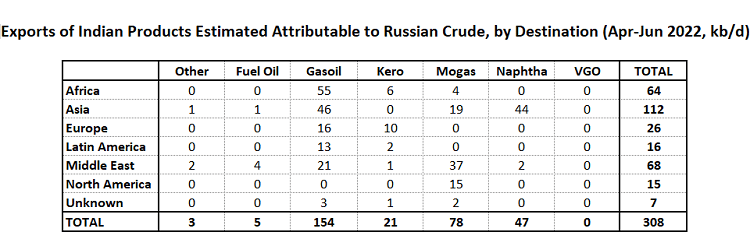
The top 5 countries importing Indian products theoretically attributable to Russian crude are the UAE (45 kb/d), South Korea (31 kb/d), South Africa (28 kb/d), Singapore (23 kb/d), and the USA (15 kb/d). The UAE and US are mostly taking gasoline (the US often brings in summer-grade Indian gasoline for peak demand season), South Africa and Singapore mostly gasoil, and South Korea mostly Naphtha.
113 kb/d or 37% of these products are being imported by countries with some form of sanctions on Russia (not necessarily oil or energy related sanctions). Of these, the top 5 countries are South Korea, Singapore, the USA, Australia, and the Netherlands.
We acknowledge the intrinsic difficulty of tracking individual Russian molecules transformed from crude into refined products in third countries. However, by leveraging Petro-Logistics’ best-in-class import & export data, along with a number of simplified assumptions, the above analysis shows the range of potential destinations for the small volumes of Russian-attributable refined products exported from India.
Please note: The unabridged version of this note was released to clients on 19 August 2022 and includes additional tables and charts. Please contact our Sales Team for full access: c2FsZXNAcGV0cm8tbG9naXN0aWNzLmNvbQ==